
Free Zoom Event
God’s Revenge Upon Murder: Florence Nightingale’s Mortality and Health Diagrams

Join the Florence Nightingale Museum from anywhere in the world as we explore Nightingale’s Statistical Work!
Florence Nightingale used colourful diagrams to persuade royals and generals to adopt reforms that prevented countless deaths. Data storyteller RJ Andrews will tell us the story of exactly how she did it. He is the chronicler of the motivation and craft behind Nightingale and her team. We will meet many colourful characters, see sample diagrams from both of her coxcomb folios, investigate hand-drawn drafts of her diagrams, and compare Nightingale’s campaign against competing efforts. By the end, we will better appreciate what it takes to bring positive change to the world.
When: Thursday 29th January
Starts: 6:00pm
The event will last around 30 minutes followed by time for questions.
This event is free to join (although we do recommend a donation if you are able to help fund future programs like this). Please reserve your space online. Link to join will be sent prior to event.
Check out the shop:
The Florence Nightingale Museum is currently the only seller of RJ Andrew’s books in England!
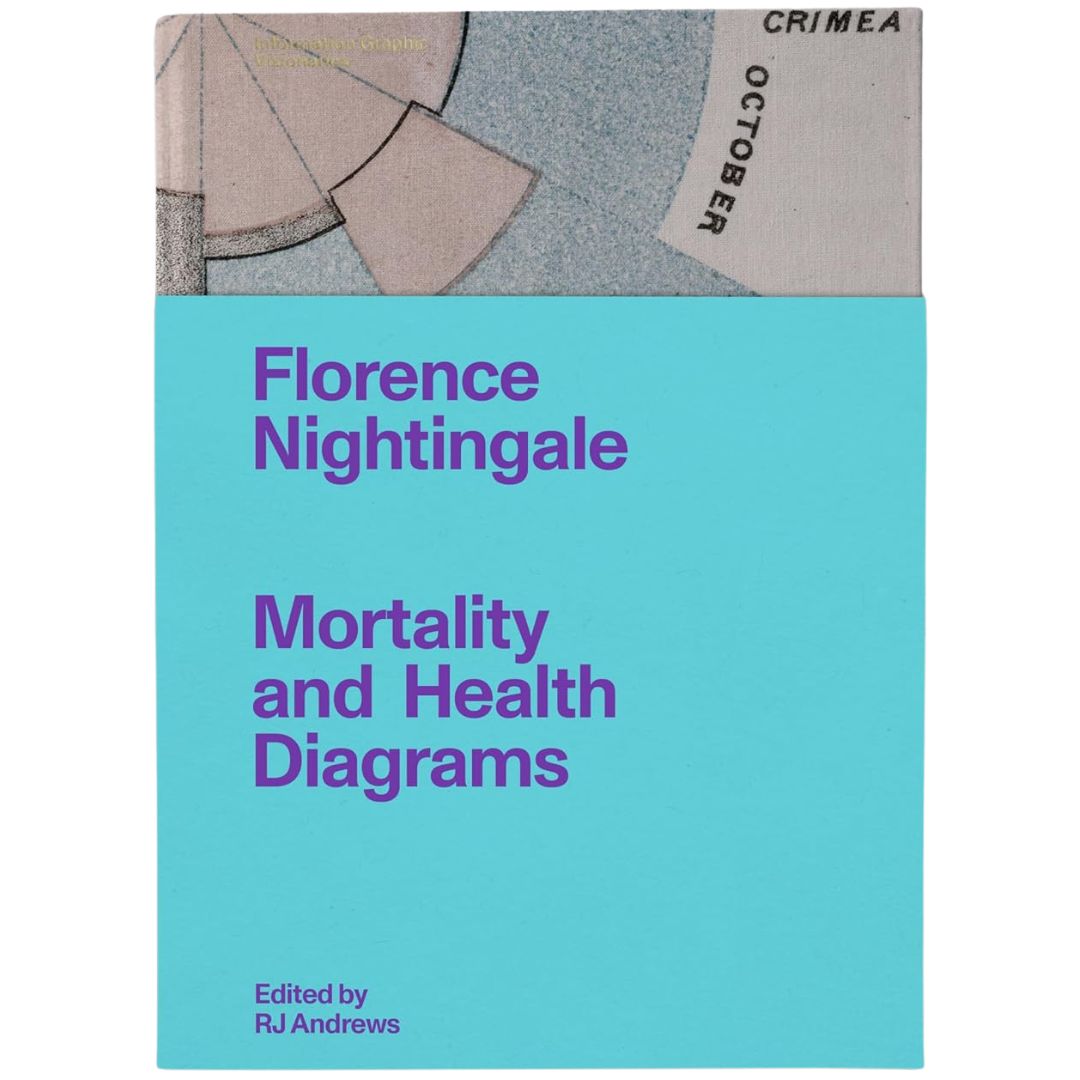 Florence Nightingale: Morality and Health Diagrams tells the story of how Nightingale used colourful diagrams to persuade royals and generals to adopt reforms that prevented countless deaths.
Info We Trust is a “love letter to data storytelling”. It takes readers on a journey through this subject, capturing its essence, with each chapter unveiling a rich tapestry of insights, tracing the evolution of charts from mere shadows of civilisation to potent instruments of persuasion.
Find these books through our shop here.
Option to attend an in-person screening of this talk in the Florence Nightingale Museum is available. To find out more please visit the event page here.